A one-minute walkthrough of the static demo: the home page and AI brief, a theme’s four tabs, one company, and a recorded answer from the agent with every lookup it made.
The problem
Most market dashboards show fifty numbers at the same weight and leave the reader to work out which two matter. Market Agent sorts a watchlist by what needs attention today, and shows why.
Two things make that harder than it sounds:
- A move only means something against the right yardstick. NVDA down 6% on a day its peers are down 6% is one theme-wide story. Down 6% while they’re flat, it is NVDA’s own.
- Language models explain well and referee badly. Left alone, they slip into advice (“a day for caution”), state causes the data doesn’t show (“fell after the export rules widened”), and fill gaps from memory that is out of date.
Why it matters
A summary is read quickly and trusted by default. A stated cause reads as a finding, and a nudge about positioning reads as advice, even when neither was meant. A wrong ranking costs attention; a wrong sentence costs trust. So the question was less “can a model write a market summary?” than “where does a model belong in this system, and how do you know its output is safe to show?”
Approach
Rank with rules, explain with the model, and test what the model writes.
01 · Data
Prices, earnings, fundamentals and news from Yahoo Finance.
02 · Rules
Python measures each move against its peers and ranks what needs attention.
03 · Model
Claude writes the brief and the analyses from the figures it is handed.
04 · Evals
Regex checks and an LLM judge grade that text against held-out scenarios.
- Measure against peers, not just an ETF. Companies are grouped into themes, each with a benchmark ETF. Cap-weighted ETFs are dominated by the companies being compared with them (NVDA is over a fifth of SMH), so each company is also measured against the median of the other companies in its theme.
- Measure earnings reactions with a market model. Each reaction is the move beyond what the stock’s beta and the market predicted, in units of its ordinary daily moves.
- Keep open-ended questions for an agent. Questions nobody can anticipate go to a tool-using agent that chooses its own lookups and shows every one.
What I built
A local dashboard and a conversational agent over the same tools:
- Home: one card per theme, how it moved against its ETF and how widely, plus an AI brief.
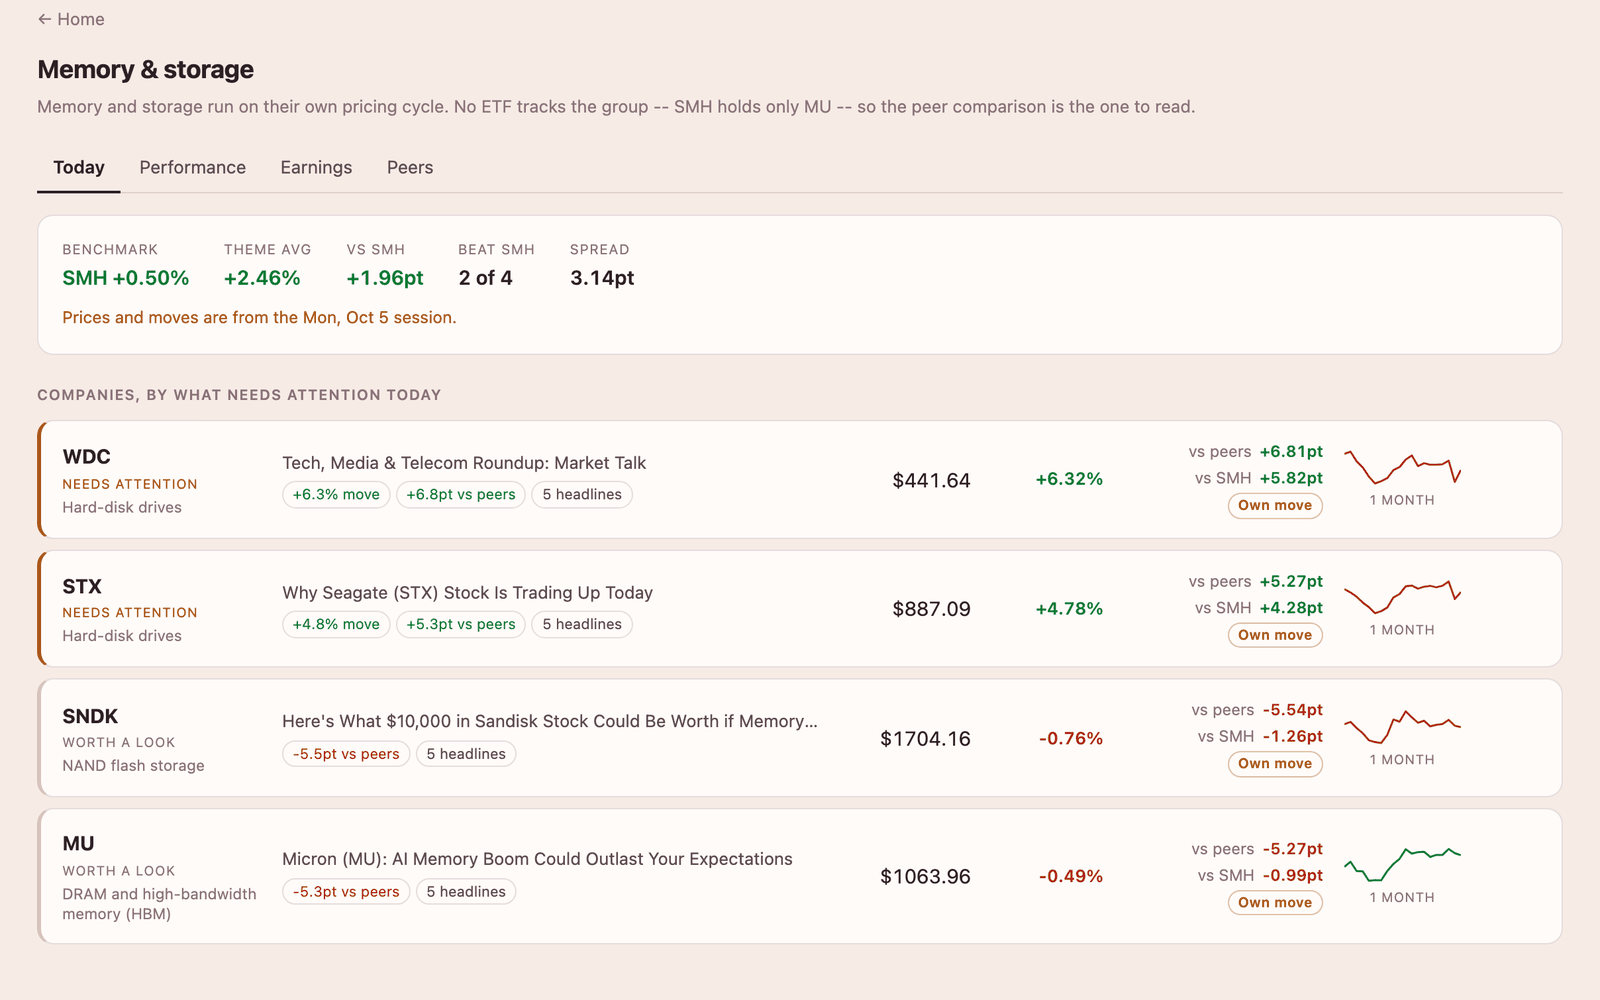
- Theme pages: today’s ranking, performance over 1M to 1Y, earnings reactions, and a peer table of valuation, margins and estimate revisions, with flags where a figure would mislead.
- Company pages: the company in its theme, its last eight earnings reactions, and its fundamentals.
- Ask: an agent with twelve tools that answers in plain prose and lists every lookup it made.
- A static demo: one day’s data captured once, so the whole app runs with no server and no key.
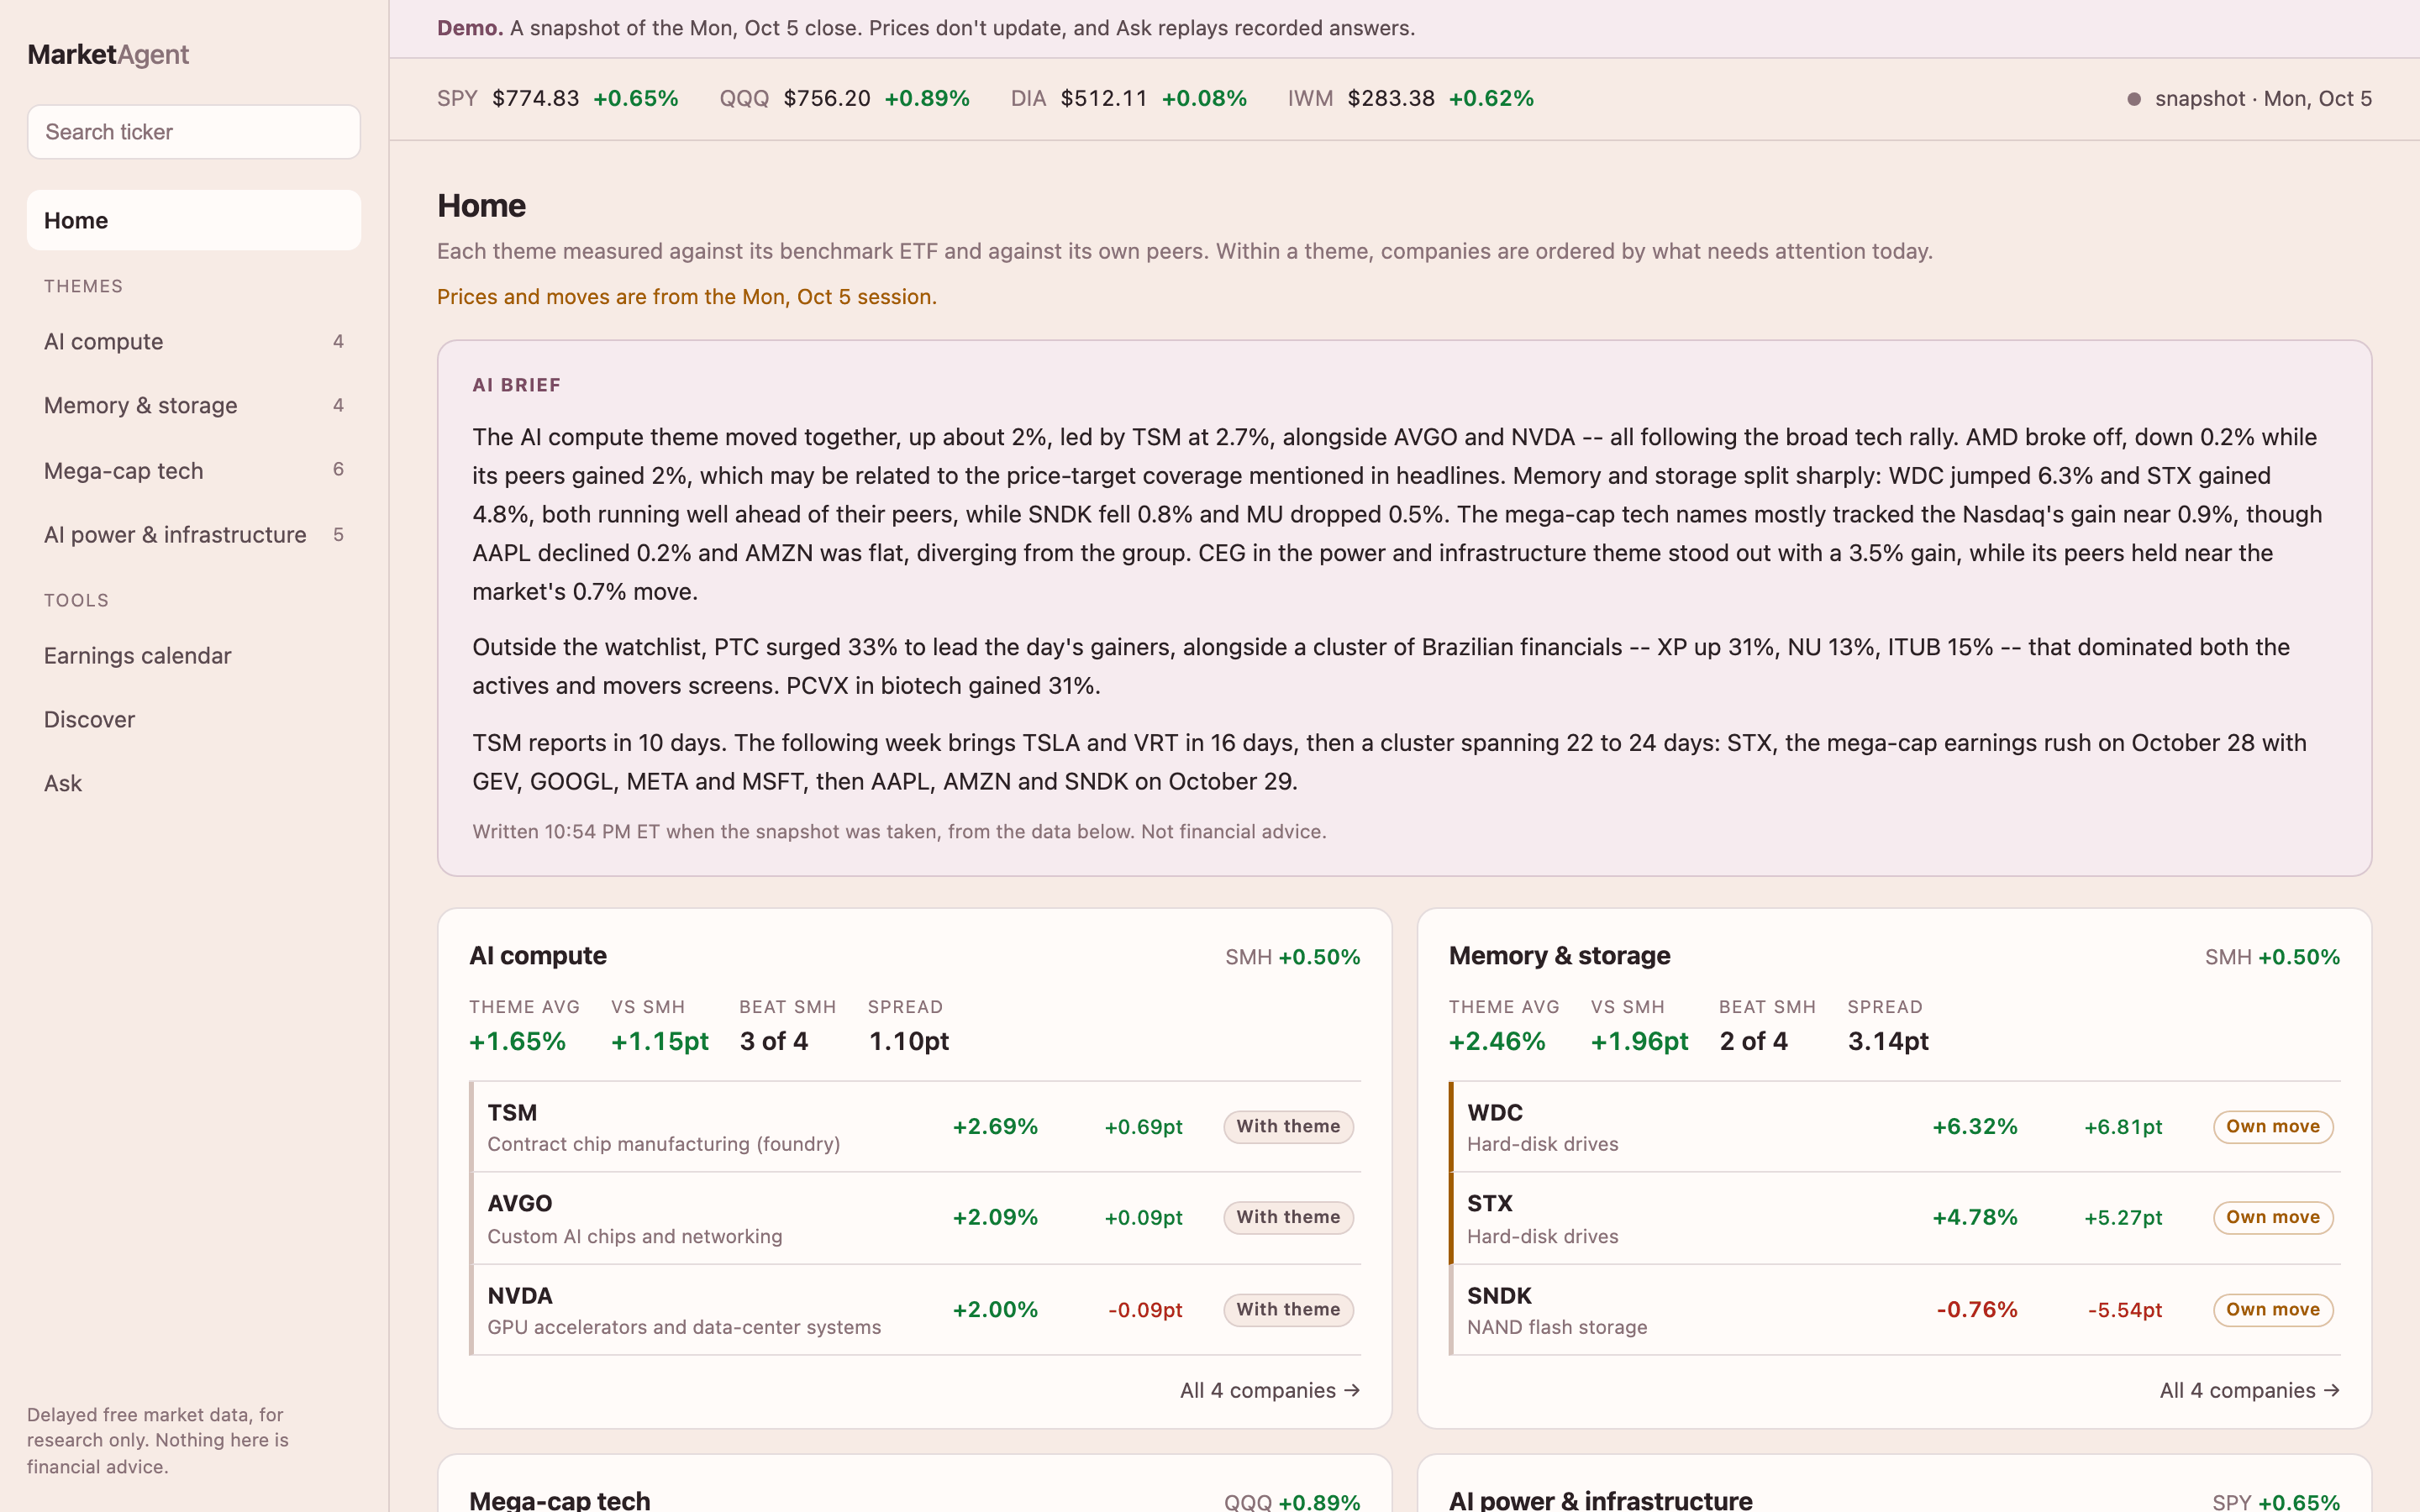
The home page: the AI brief tells each theme’s story once; the cards show each company against its ETF and its peers.
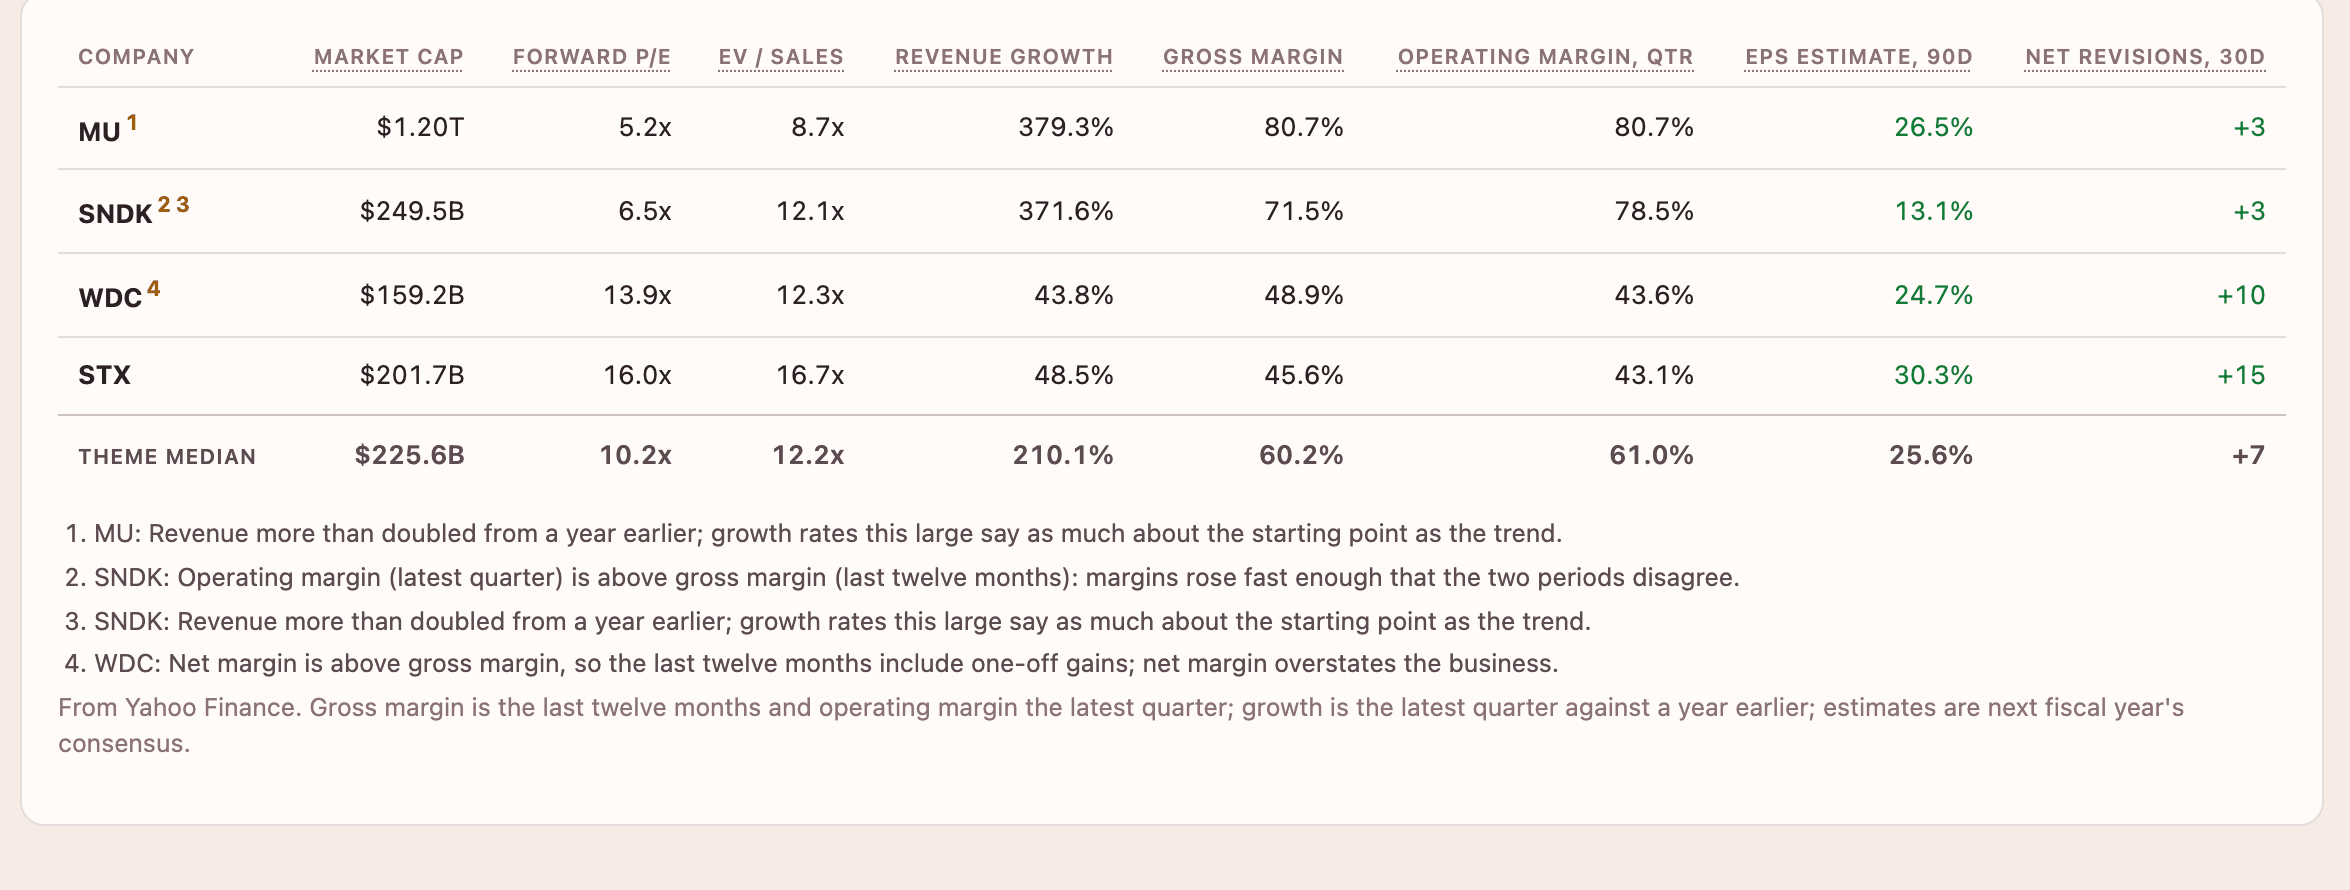
A peer table. The footnotes are generated: a net margin above gross margin, for instance, is flagged as one-off gains.
Key decisions
- The model never ranks. The dashboard knows in advance what every row needs, so Python fetches and ranks; a model would be a slow, costly and inconsistent sorting function.
- Medians, not means. The peer comparison started as a mean, until an eval fixture showed one jumping peer making three flat ones look as if they had all diverged.
- Beta only, no alpha. The first market model also subtracted alpha. During a strong rally that turned run-ups into abnormal returns of −24% to −46%, so alpha was dropped and a test now guards it.
- Move work from the model to Python. When the model got a calendar or a currency wrong, the fix was to hand it data it couldn’t misread (a pre-sorted list of reports with dates, amounts labelled with their currency) rather than another prompt rule.
Results
- Prompts, measured on scenarios held out from tuning. The daily brief went from 14/40 to 31/40 and the stock analysis from 18/24 to 45/48. The train/test split was committed before the baseline ran. With about 32 trials a set, differences under about 25 points are noise; the brief’s gain is about twice that, the analysis gain is directional.
- The ranking, backtested over two years. On 19 companies, the attention score agreed with the market’s own record of attention: the top-ranked company had its theme’s most unusual volume on 42% of days, against 22% by chance. The same test showed its bias toward volatile stocks: TSLA topped its theme on 41% of days, against an even 17%.
- Errors found in the demo, fixed and re-measured. Rebuilt from that day’s input, the brief got the earnings calendar right in 8/8 runs, up from 4/8; the agent flagged a one-off margin in 5/5, up from 0/3.
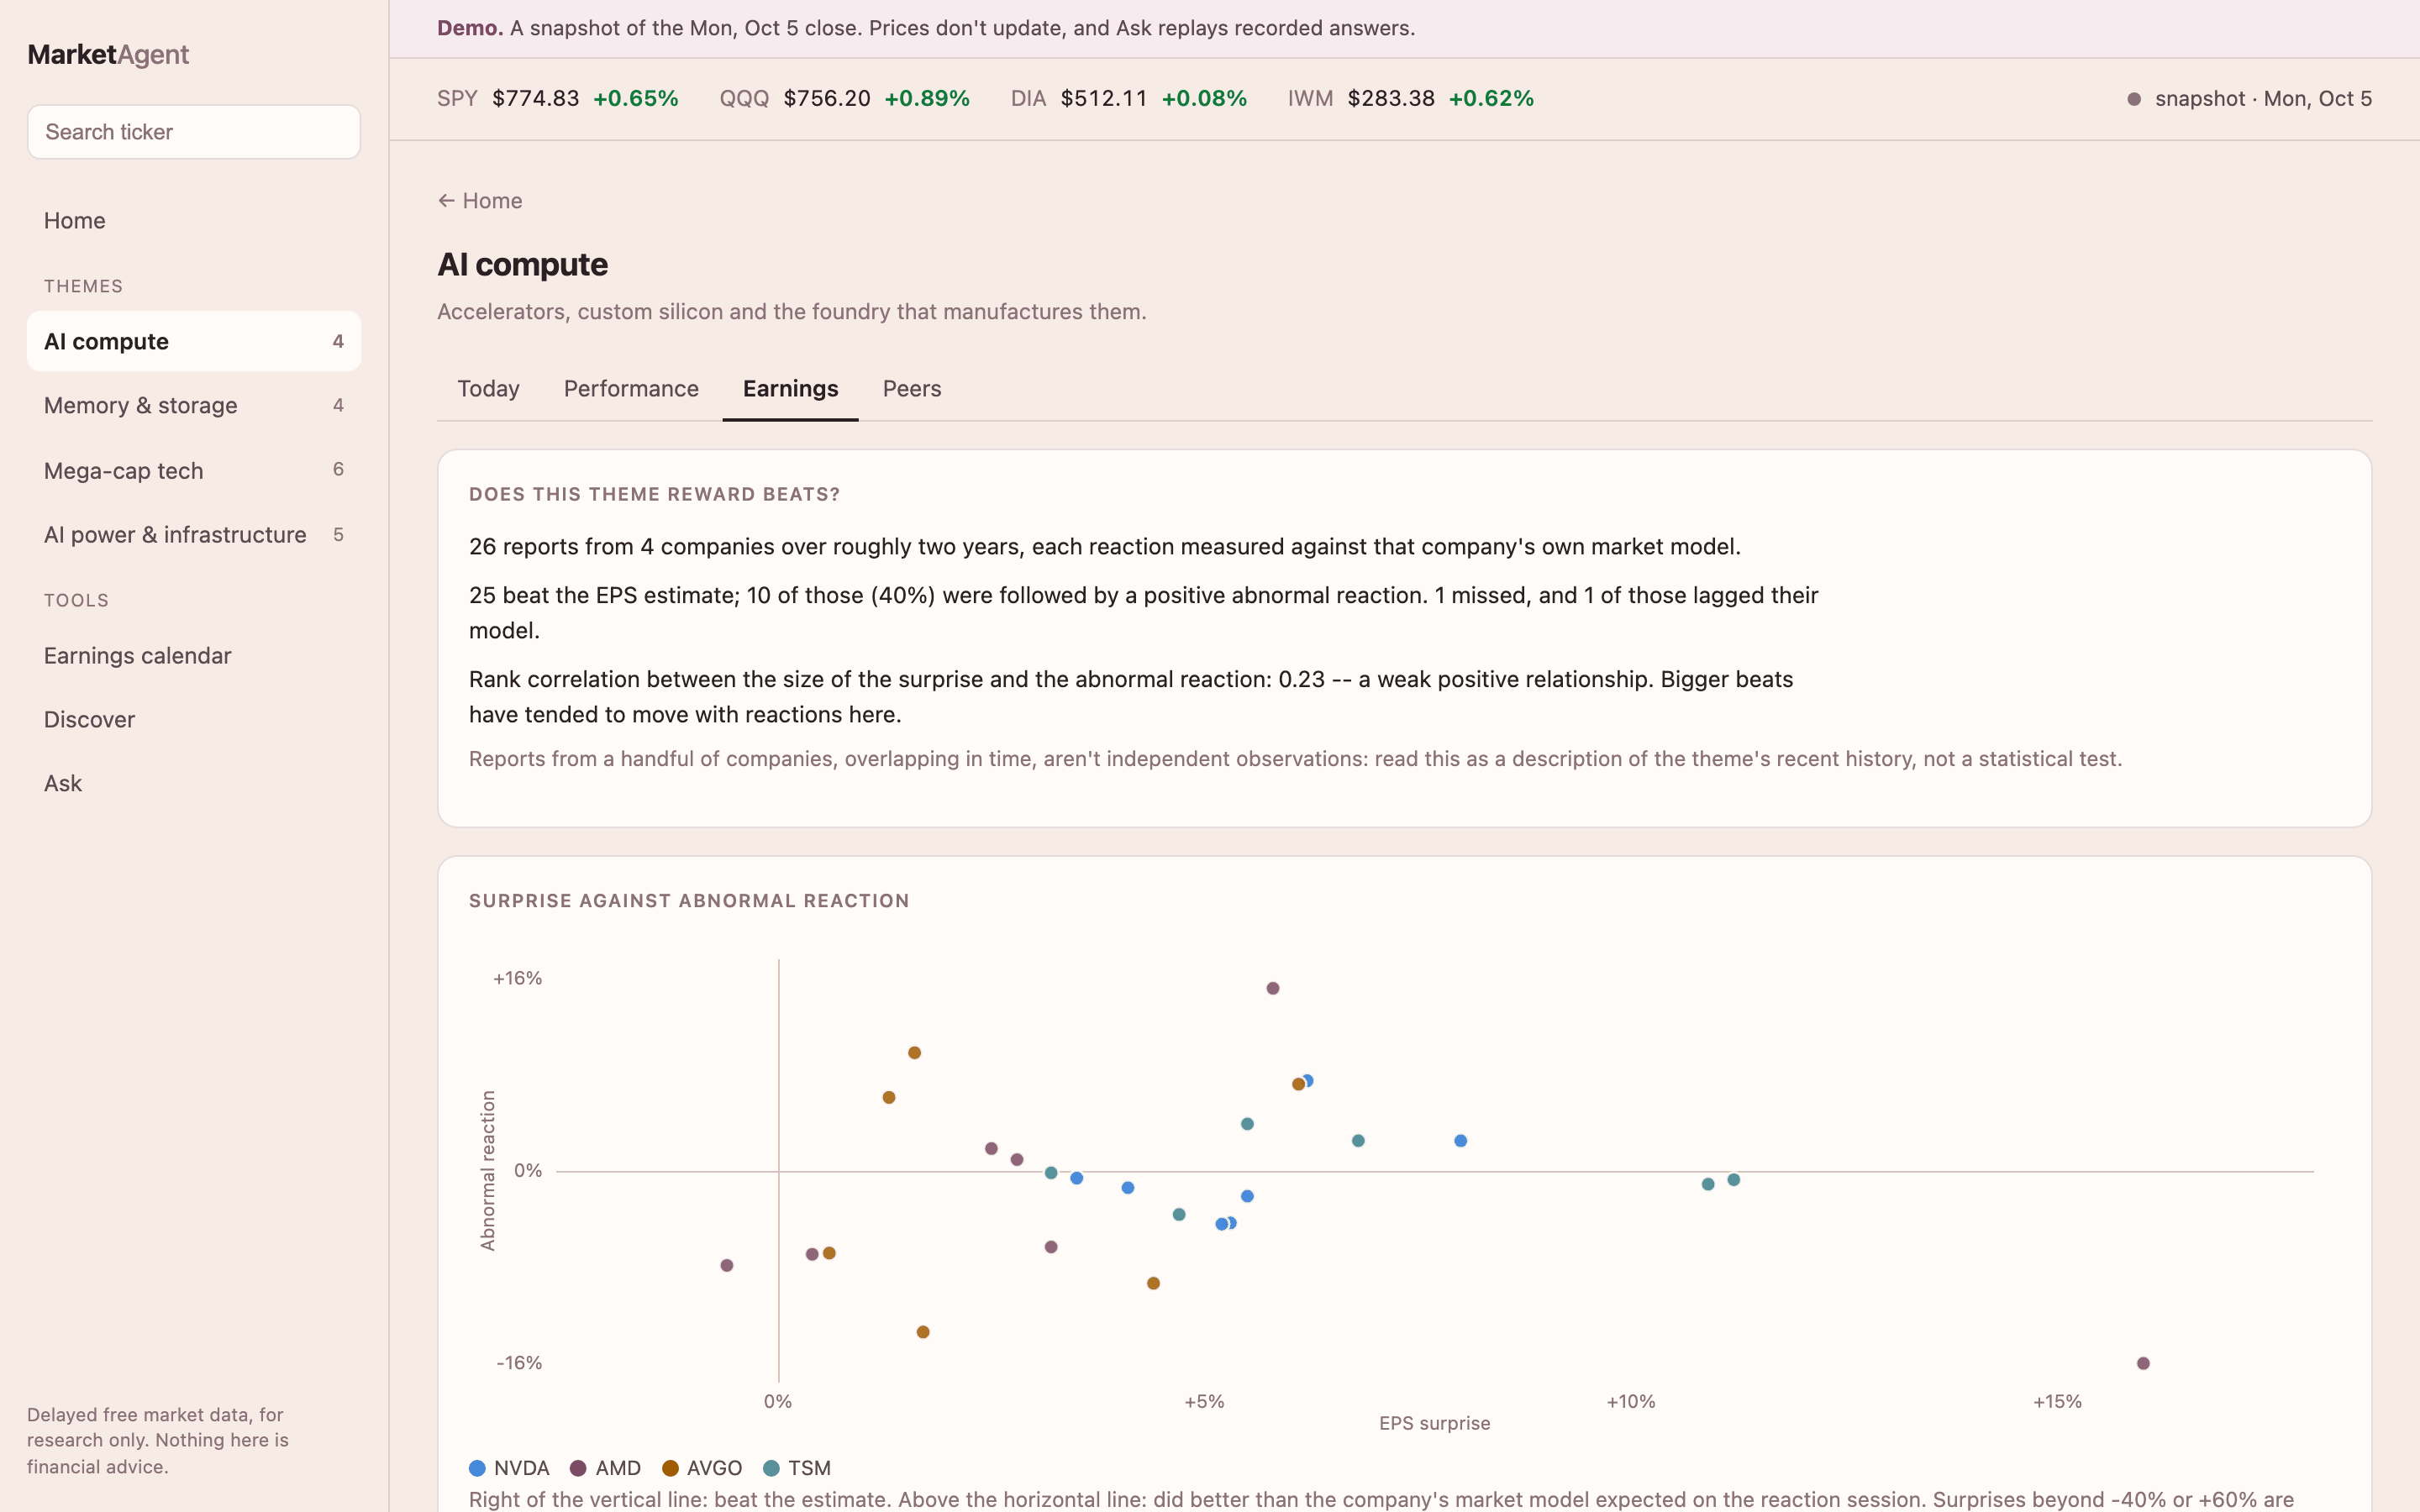
Earnings reactions across a theme: each point is one report, EPS surprise against the move beyond what the market model predicted.
Limitations
- Free, delayed data from Yahoo Finance: no intraday streaming, and a source that changes without notice.
- The public version is a snapshot of one day; its Ask panel replays recorded answers.
- The attention score’s weights are hand-set. The backtest suggests better ones; they haven’t been validated on data they weren’t designed on, so they aren’t applied.
- The eval samples are small, so modest differences between prompt versions can’t be told from noise.
What I learned
- Check what the data contains before designing around it. A missing parser package once looked like a dead endpoint, an operating margin turned out to be quarterly beside a twelve-month gross margin, and an empty news feed looked like a quiet news day.
- Give the model less to work out. Sorting, dates, currencies and caveats moved into Python fixed errors that prompt instructions hadn’t.
- Test the tests. Judges misread data and rubrics carry their own mistakes; a fair before-and-after means the same judge on both sides, and results that only count on scenarios held out from tuning.
Tech stack
- Python for the data layer, ranking and statistics: pandas, yfinance, Flask.
- Claude API (claude-sonnet-4-5) for the brief, the analyses and the agent.
- Front end in plain JavaScript, with no build step.
- Testing: offline test suites (about 400 checks) run on every push in GitHub Actions; model evals run on demand.
- Developed with Claude Code.